
Sales Dashboard
Design lead, research, requirements gathering, visual design, sprint reviews. Managed a designer throughout the project cycle.
From a table report that leadership team used to get on a daily email, to a mobile app that allows them to see up-to-date sales data on demand. Mobile application prototype to visualize sales, traffic, and conversion rate data of a retail store. App allows leadership, merchants, store managers, and other teams to make informed decisions and see trends. This was a Windows phone 8 app created in 2013. You can watch a video of the prototype down below.
The challenges
The project initiated when I was asked to re-design an email received daily by the leadership team and other stakeholders. This email contained a table view with sales data of the previous day. The information was crucial for decision making, and consuming it in a table inside an email was not the best solution, therefore, I proposed a way to visualize and consume the data in a more practical way.
Goals
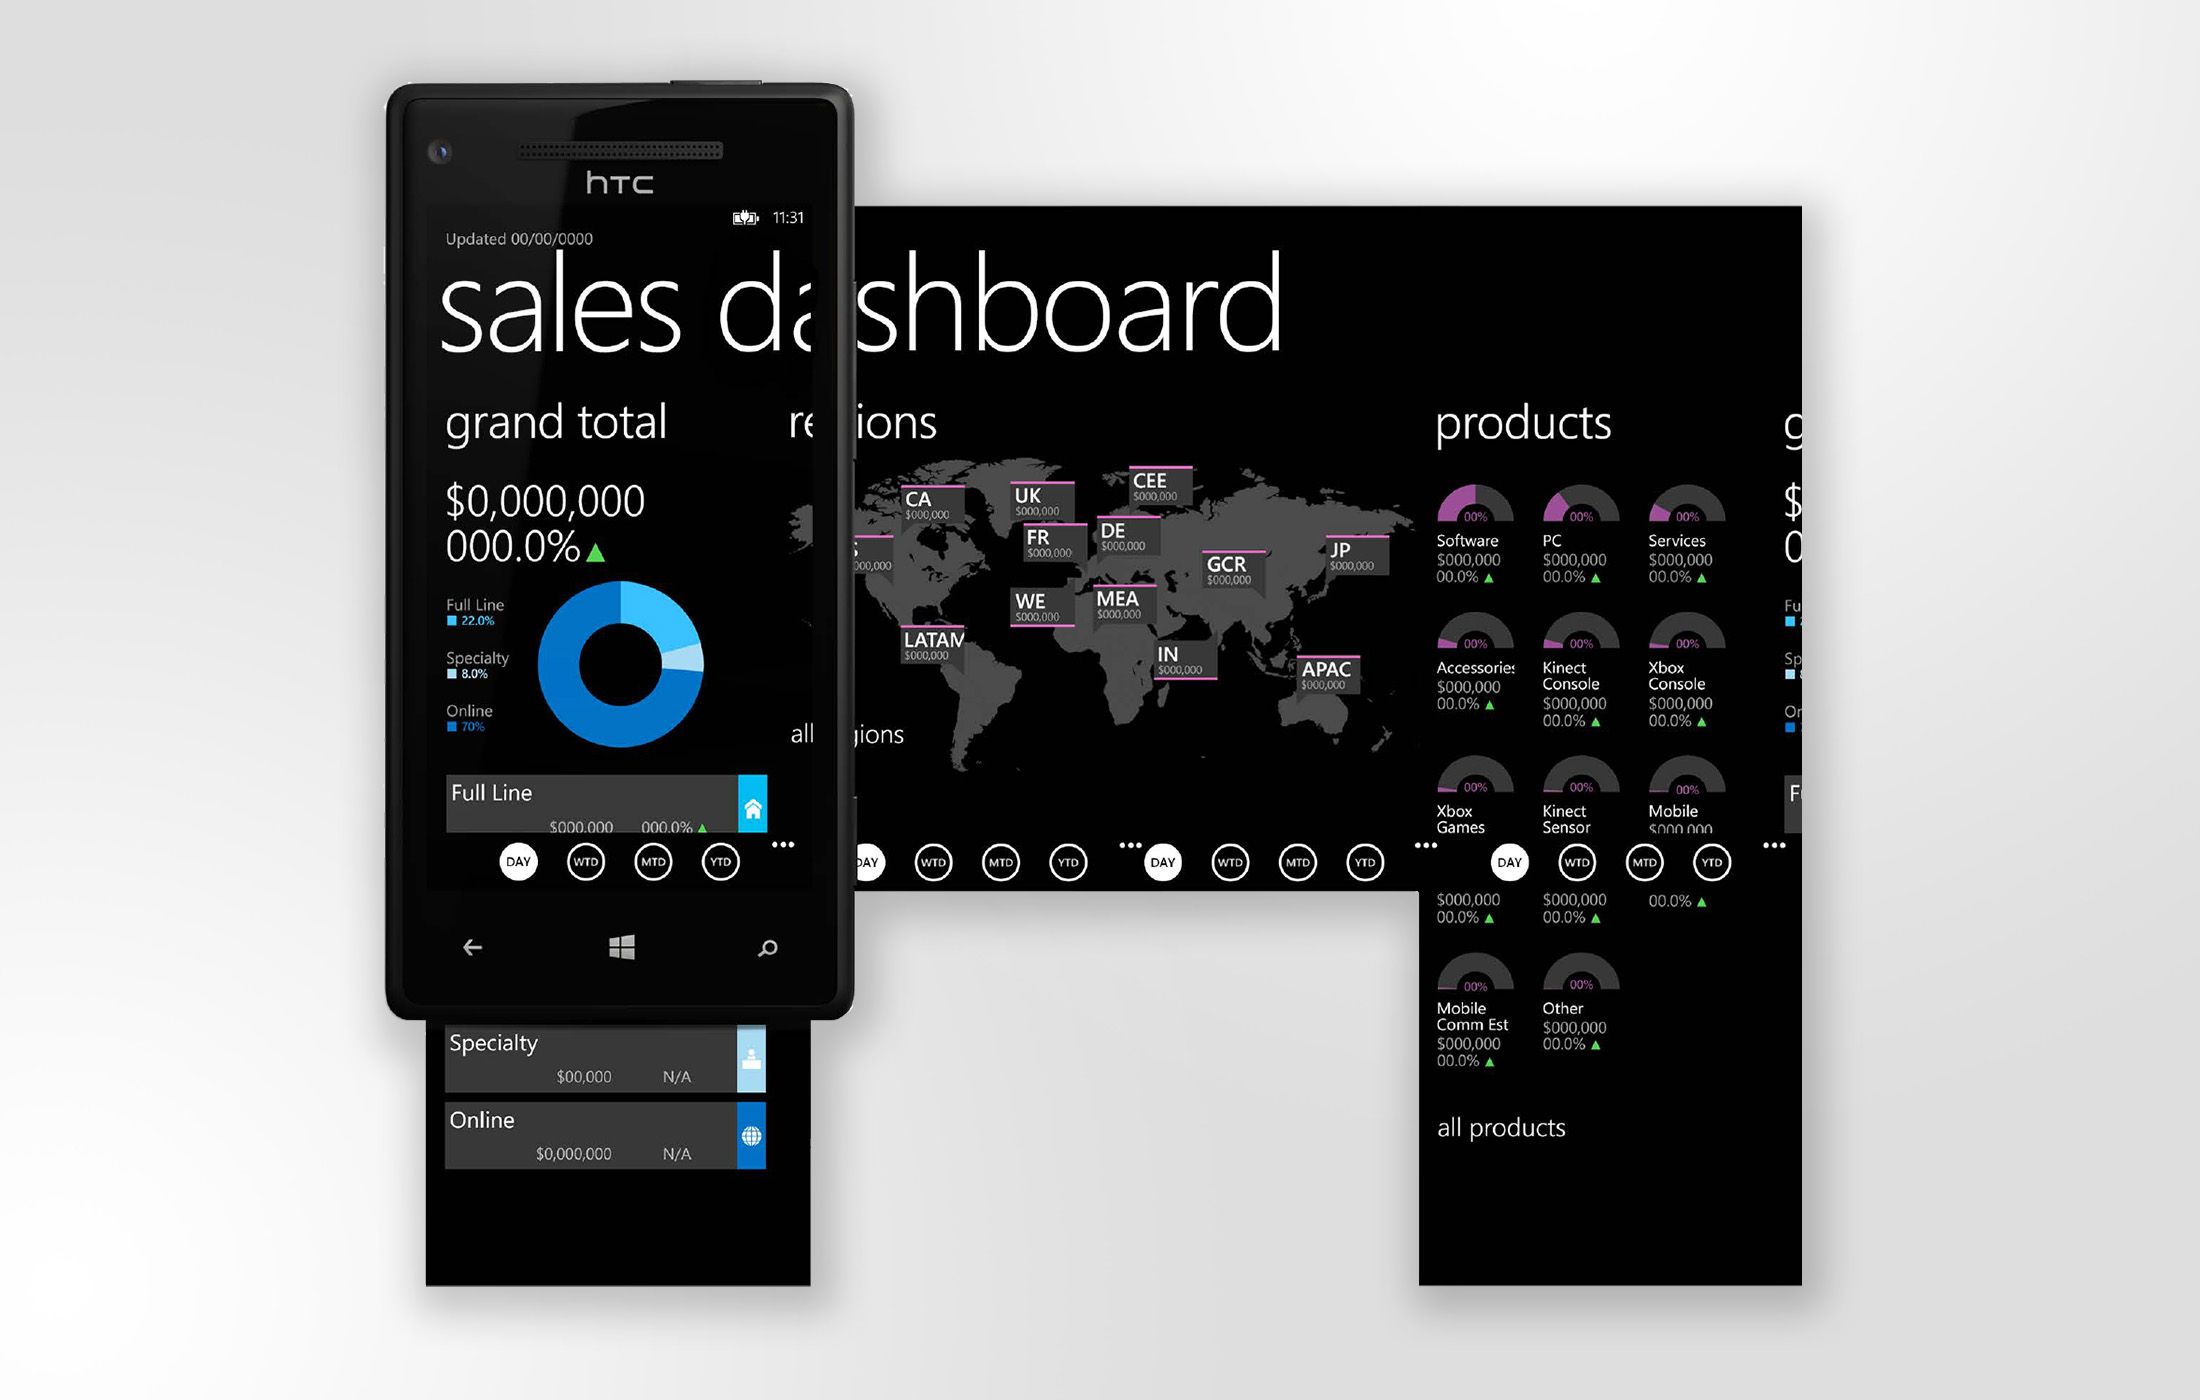
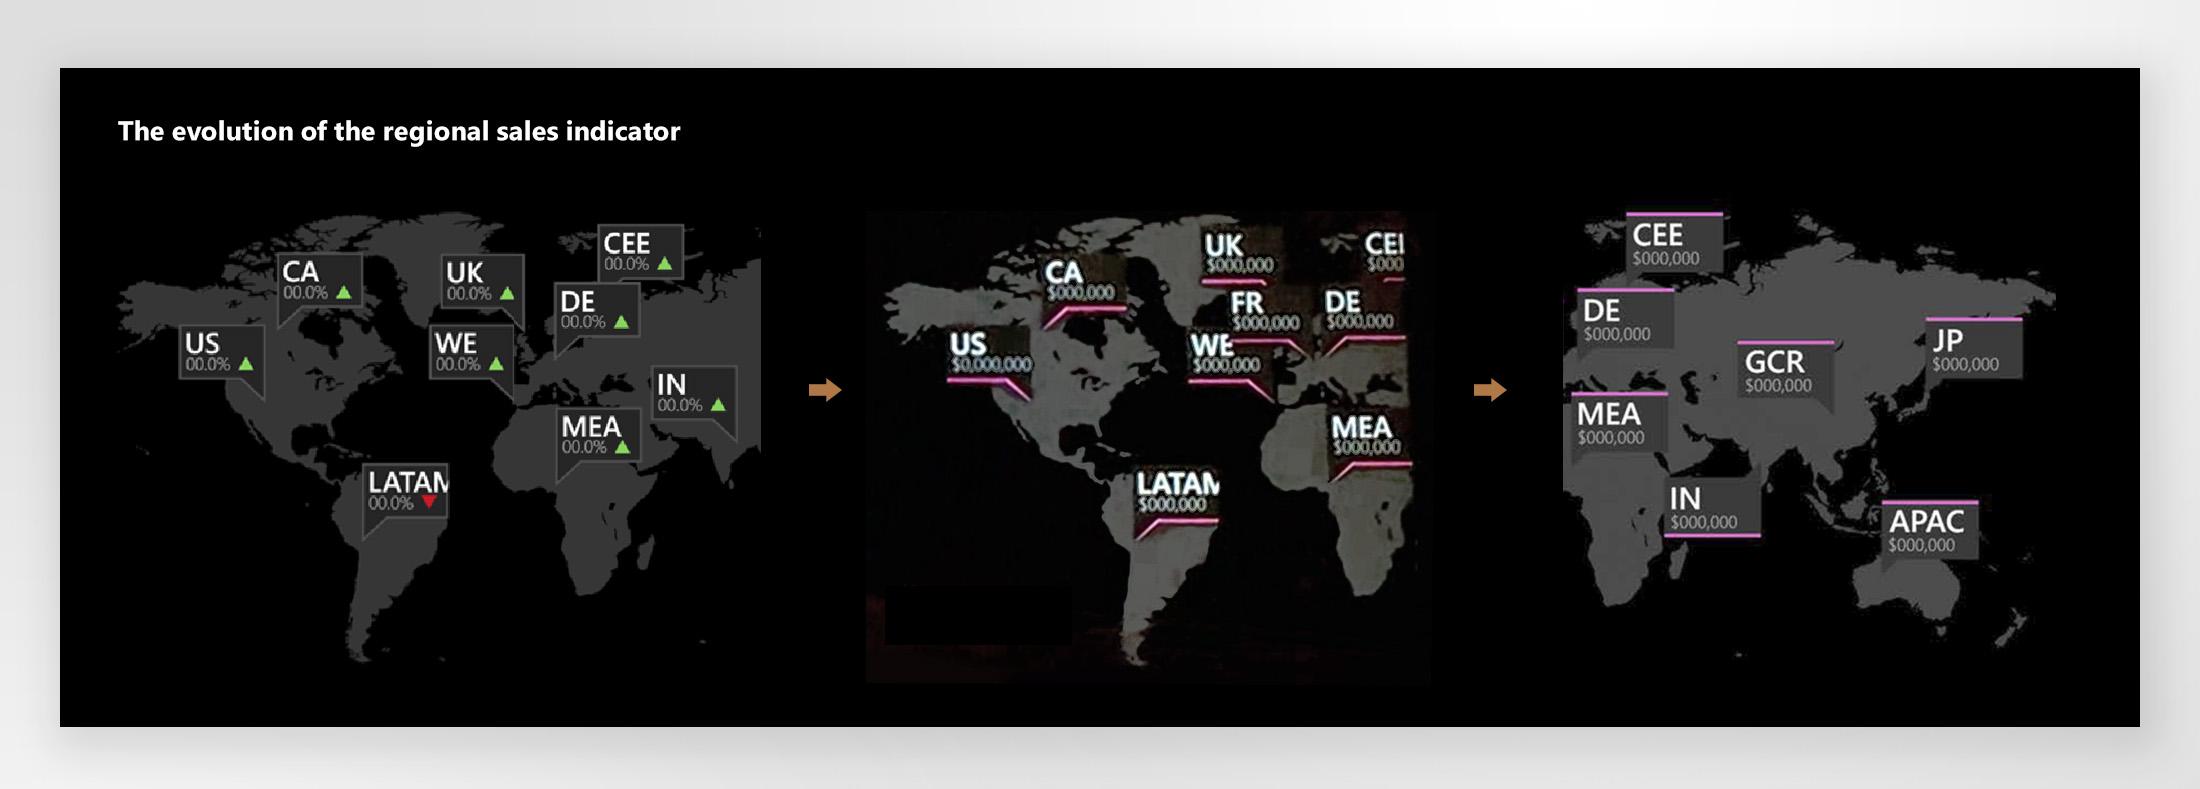
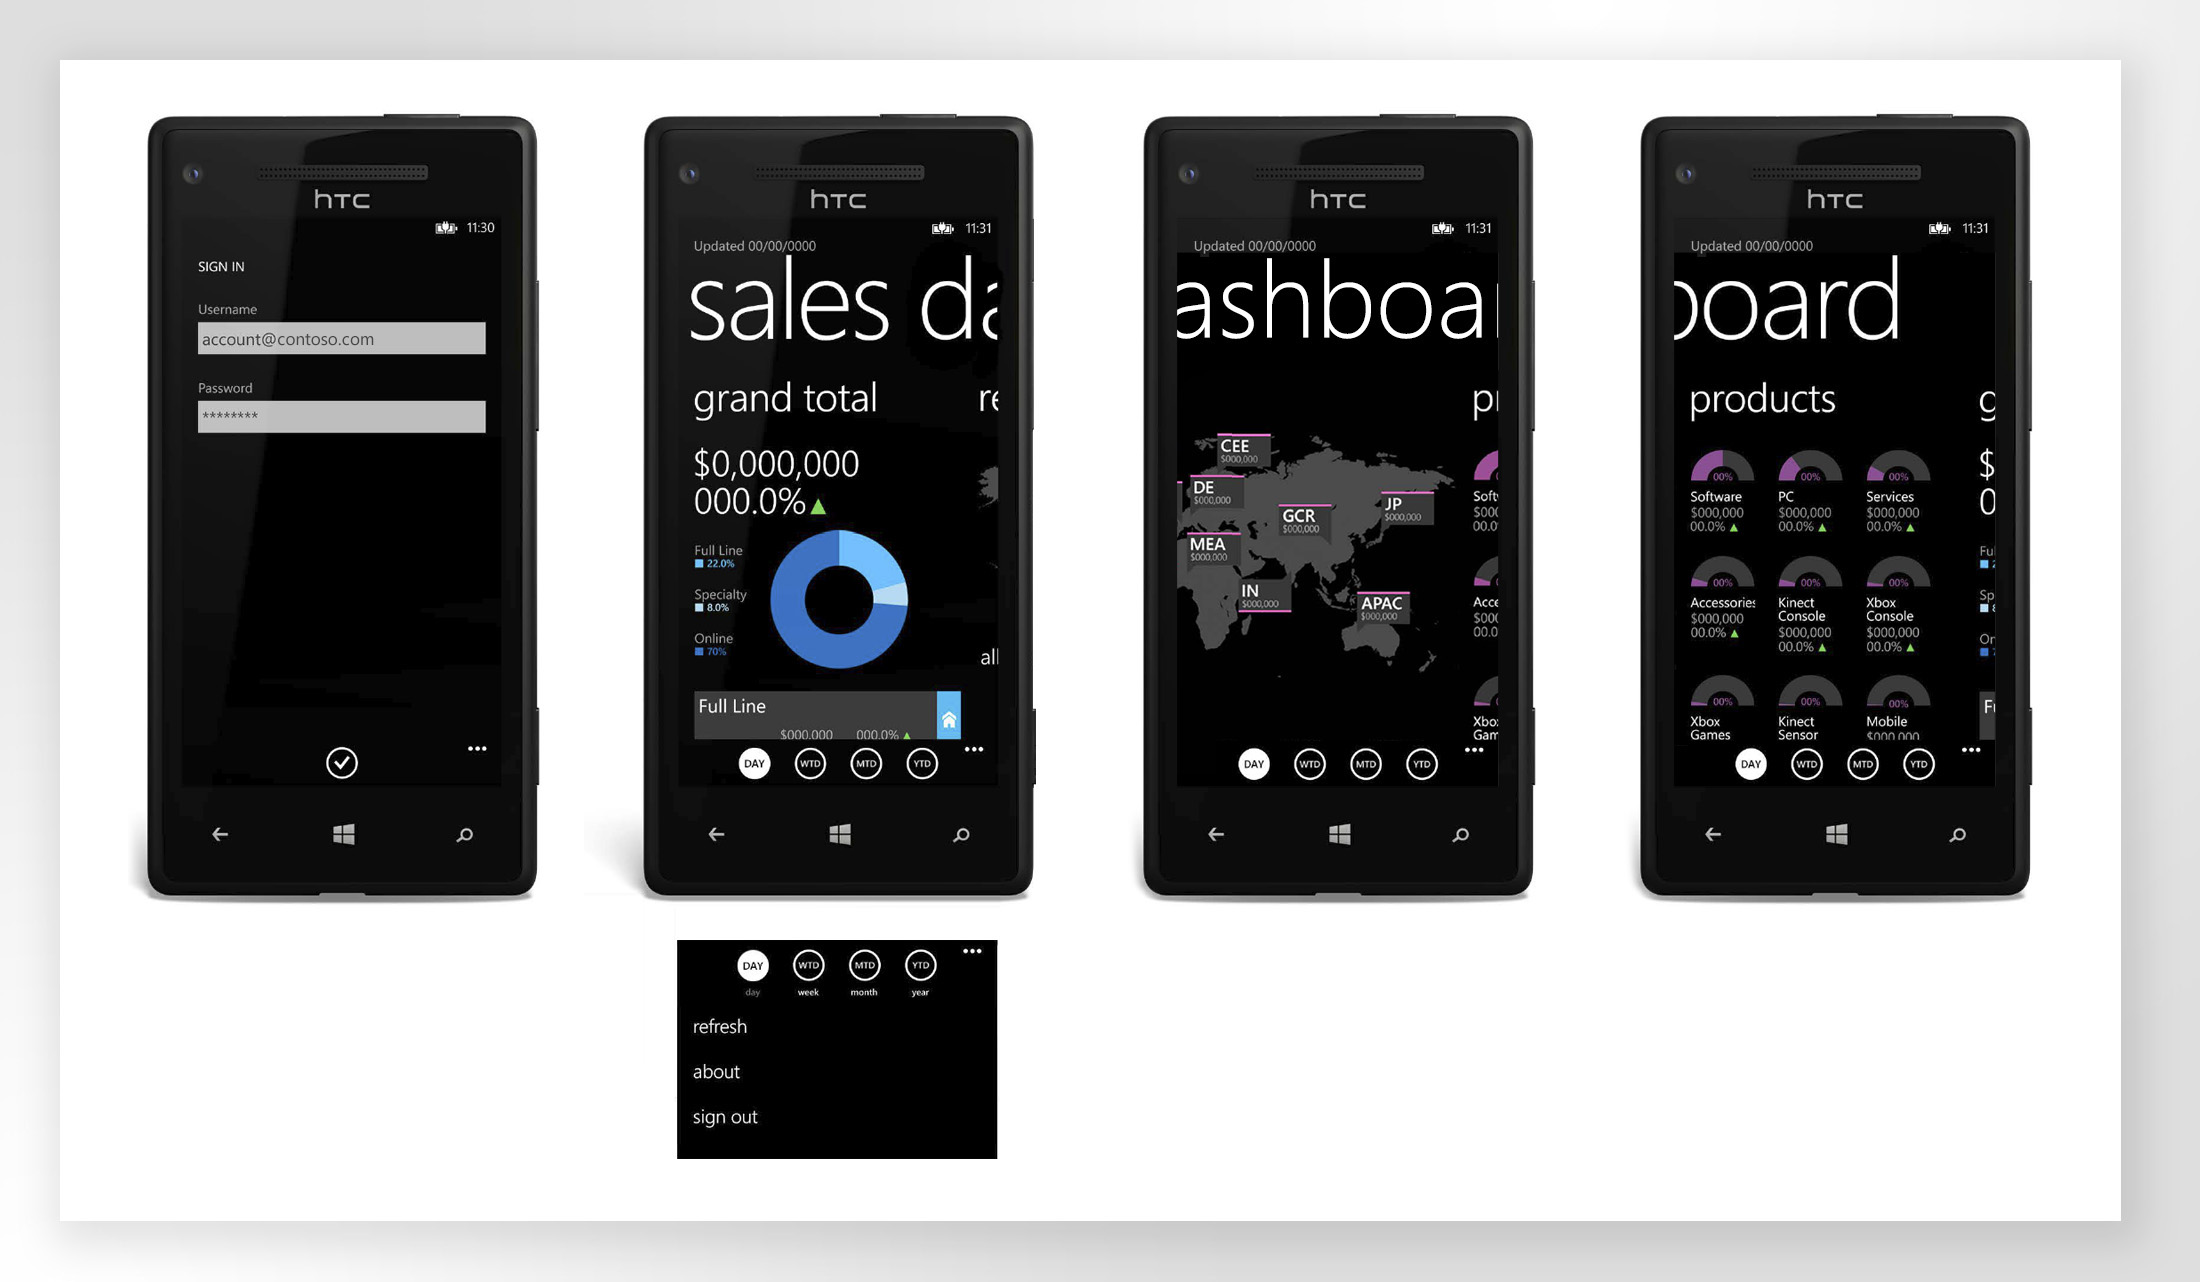
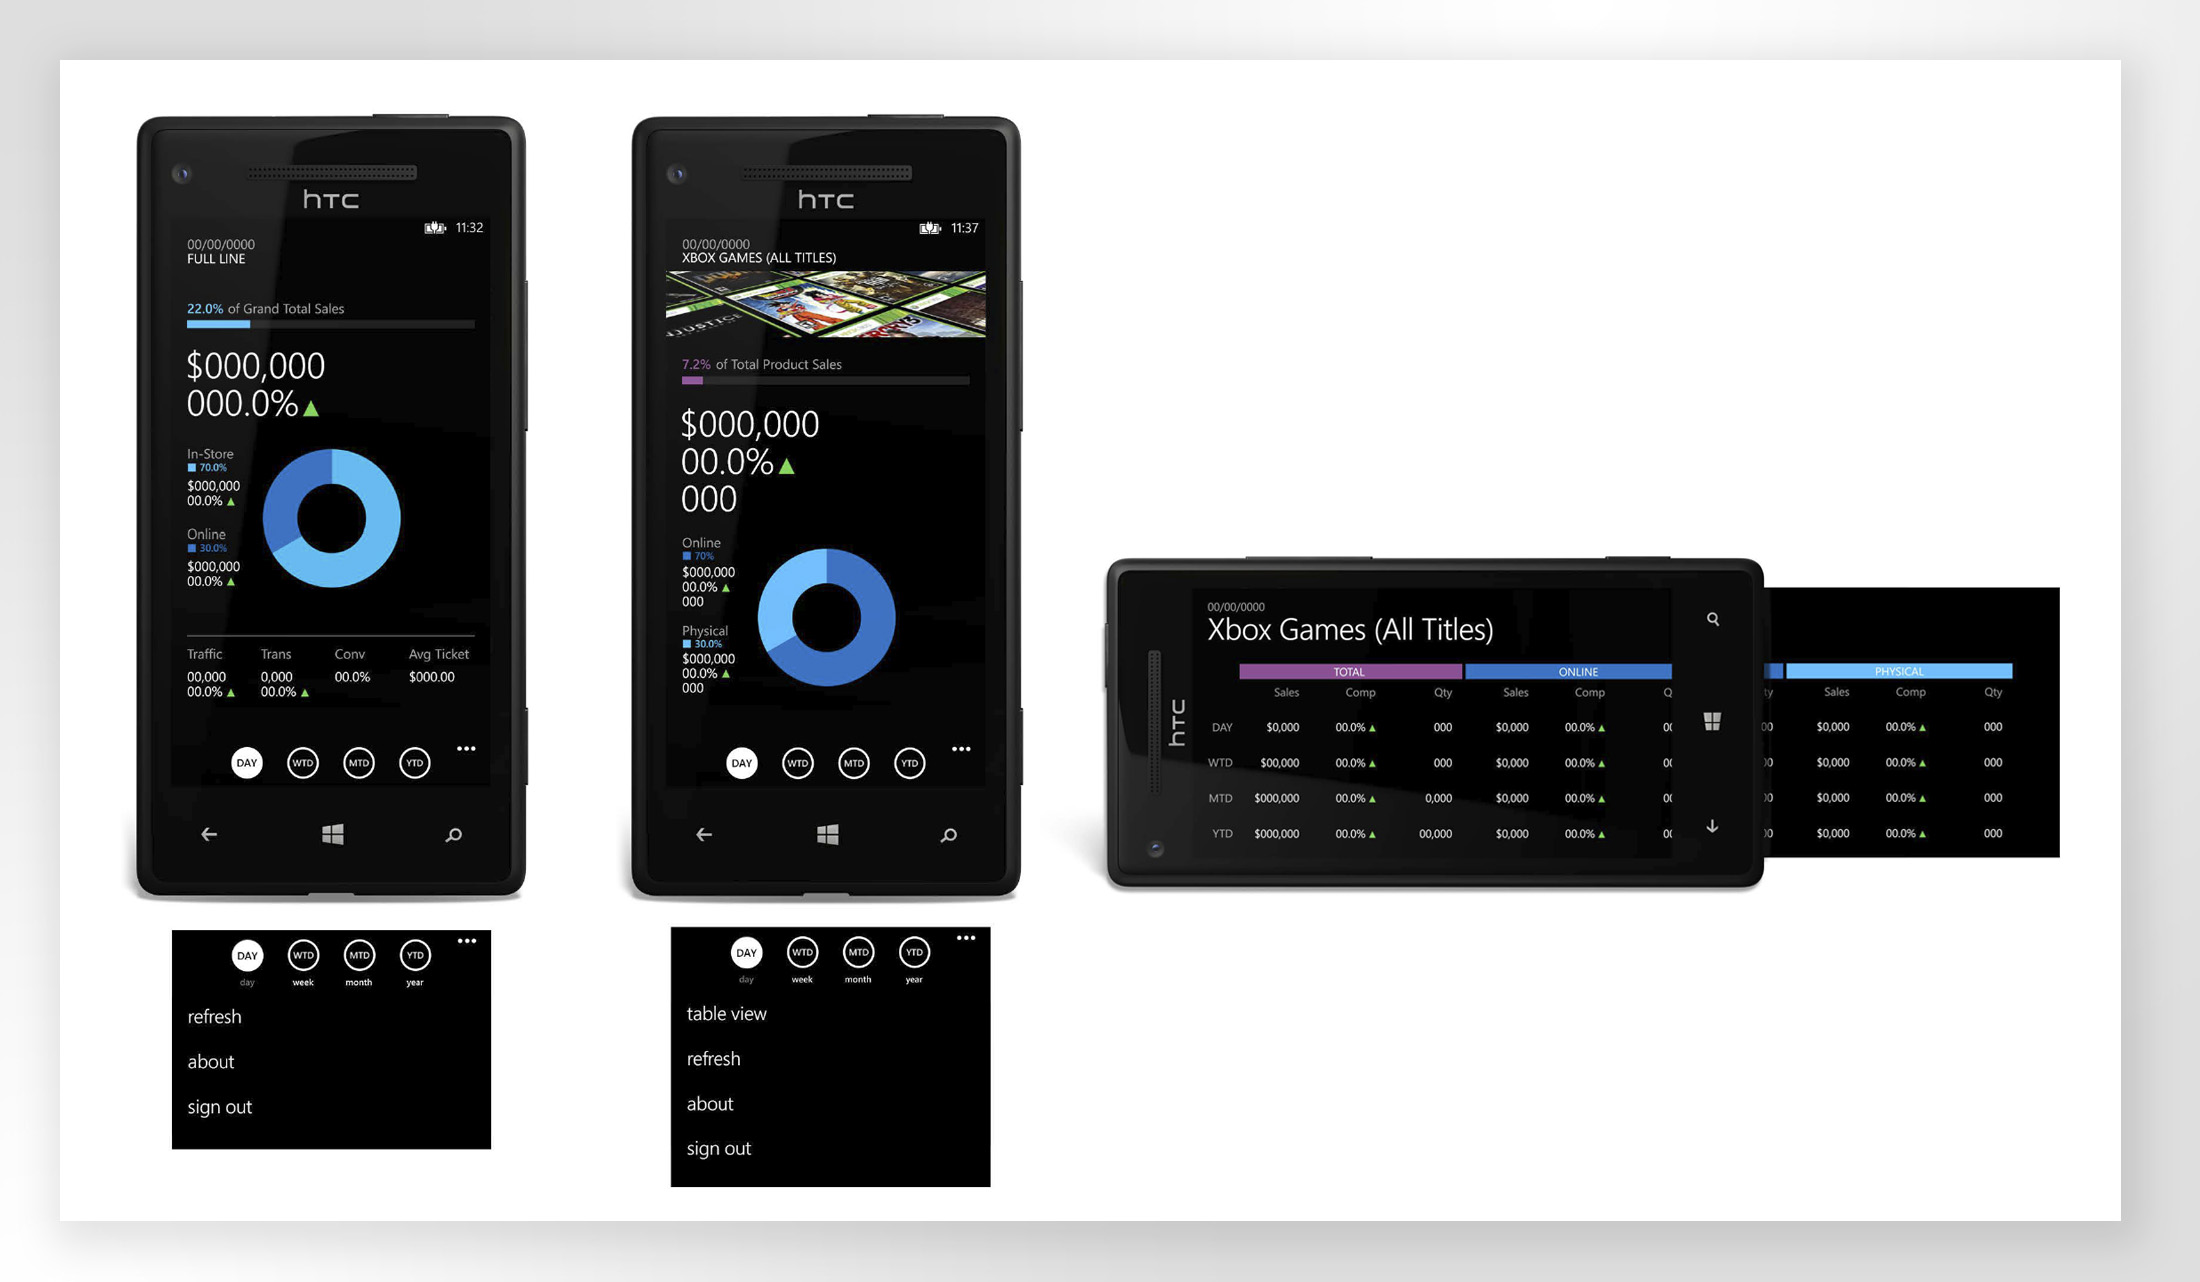
Main goal was to create a mobile app to display sales data of a retail store and have the ability to drill down into the information at different levels: by store channel, region, products, and specific store.
Approach
In order to understand the metrics and priorities for each key stakeholder type, I engaged in multiple conversations with members of the team. Very early on I onboarded another designer to help create this application, and also worked closely with the store’s creative director to brainstorm and receive feedback.
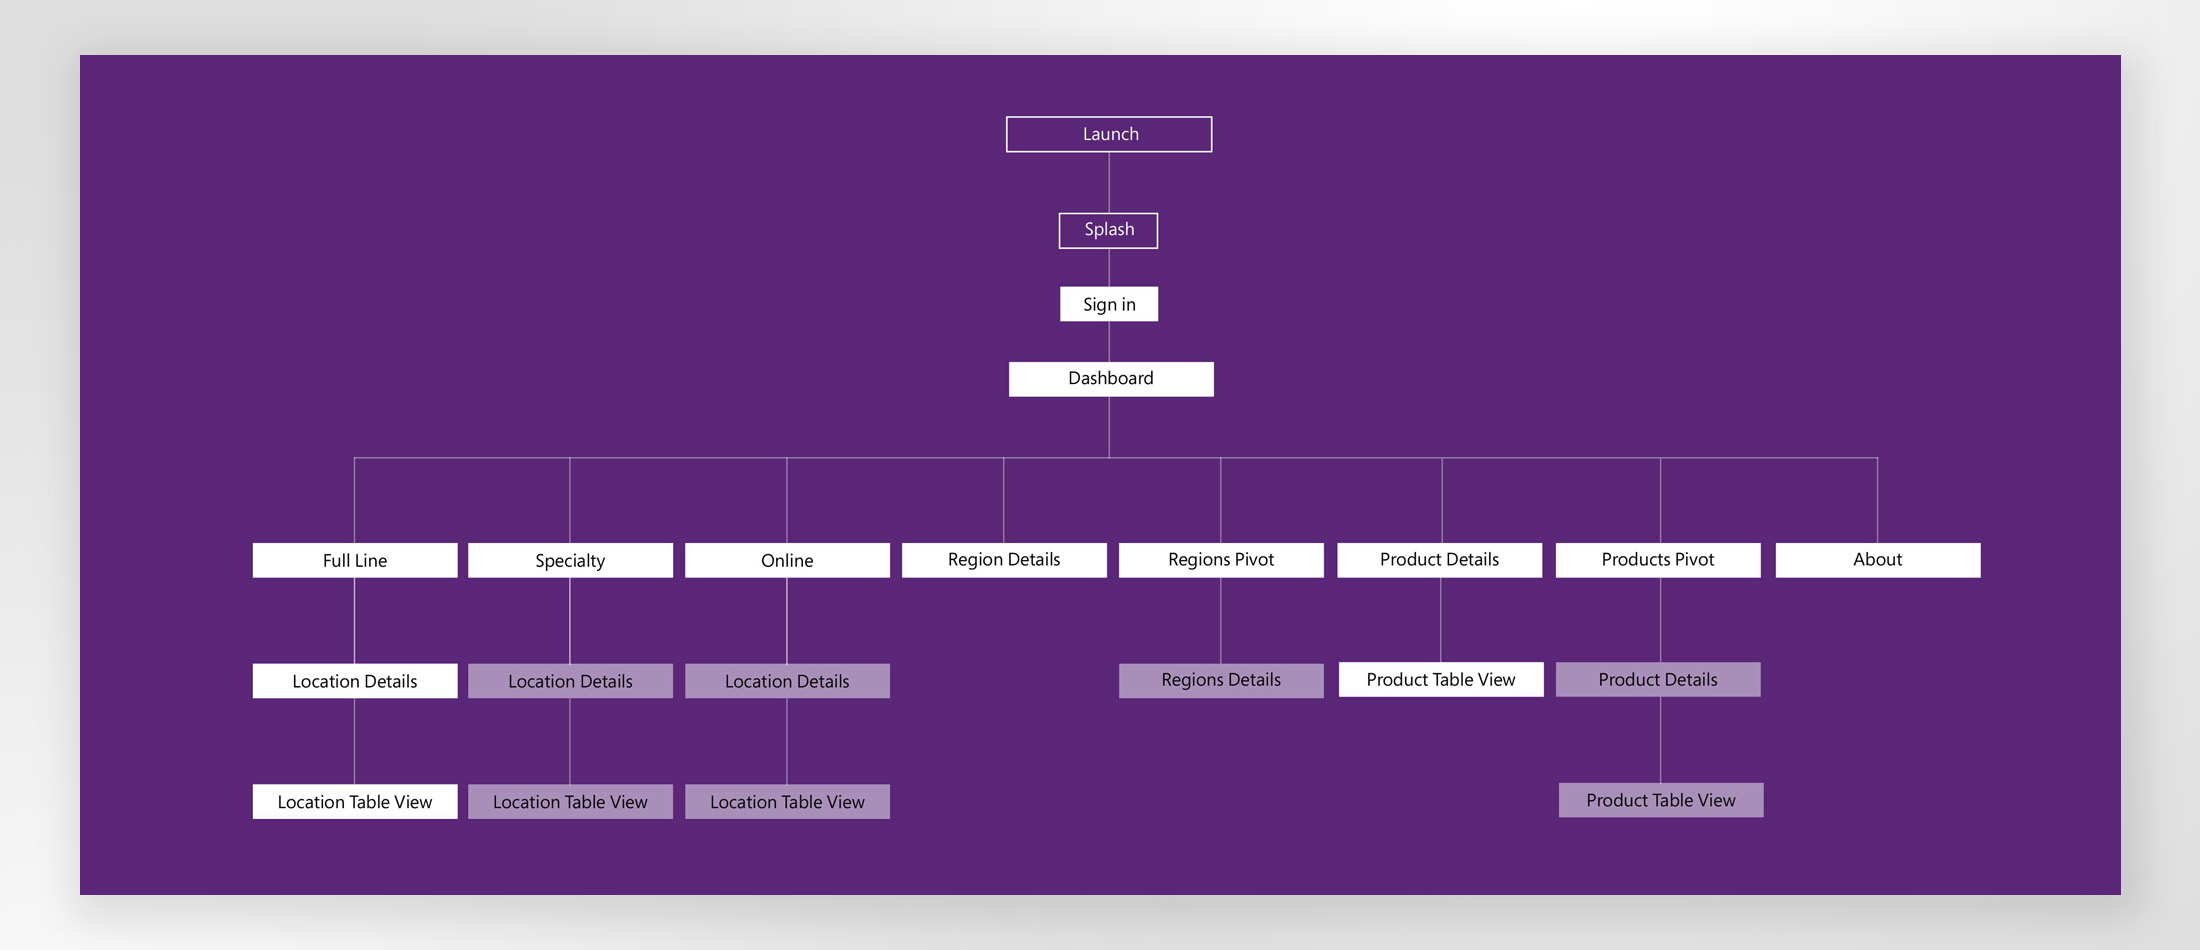
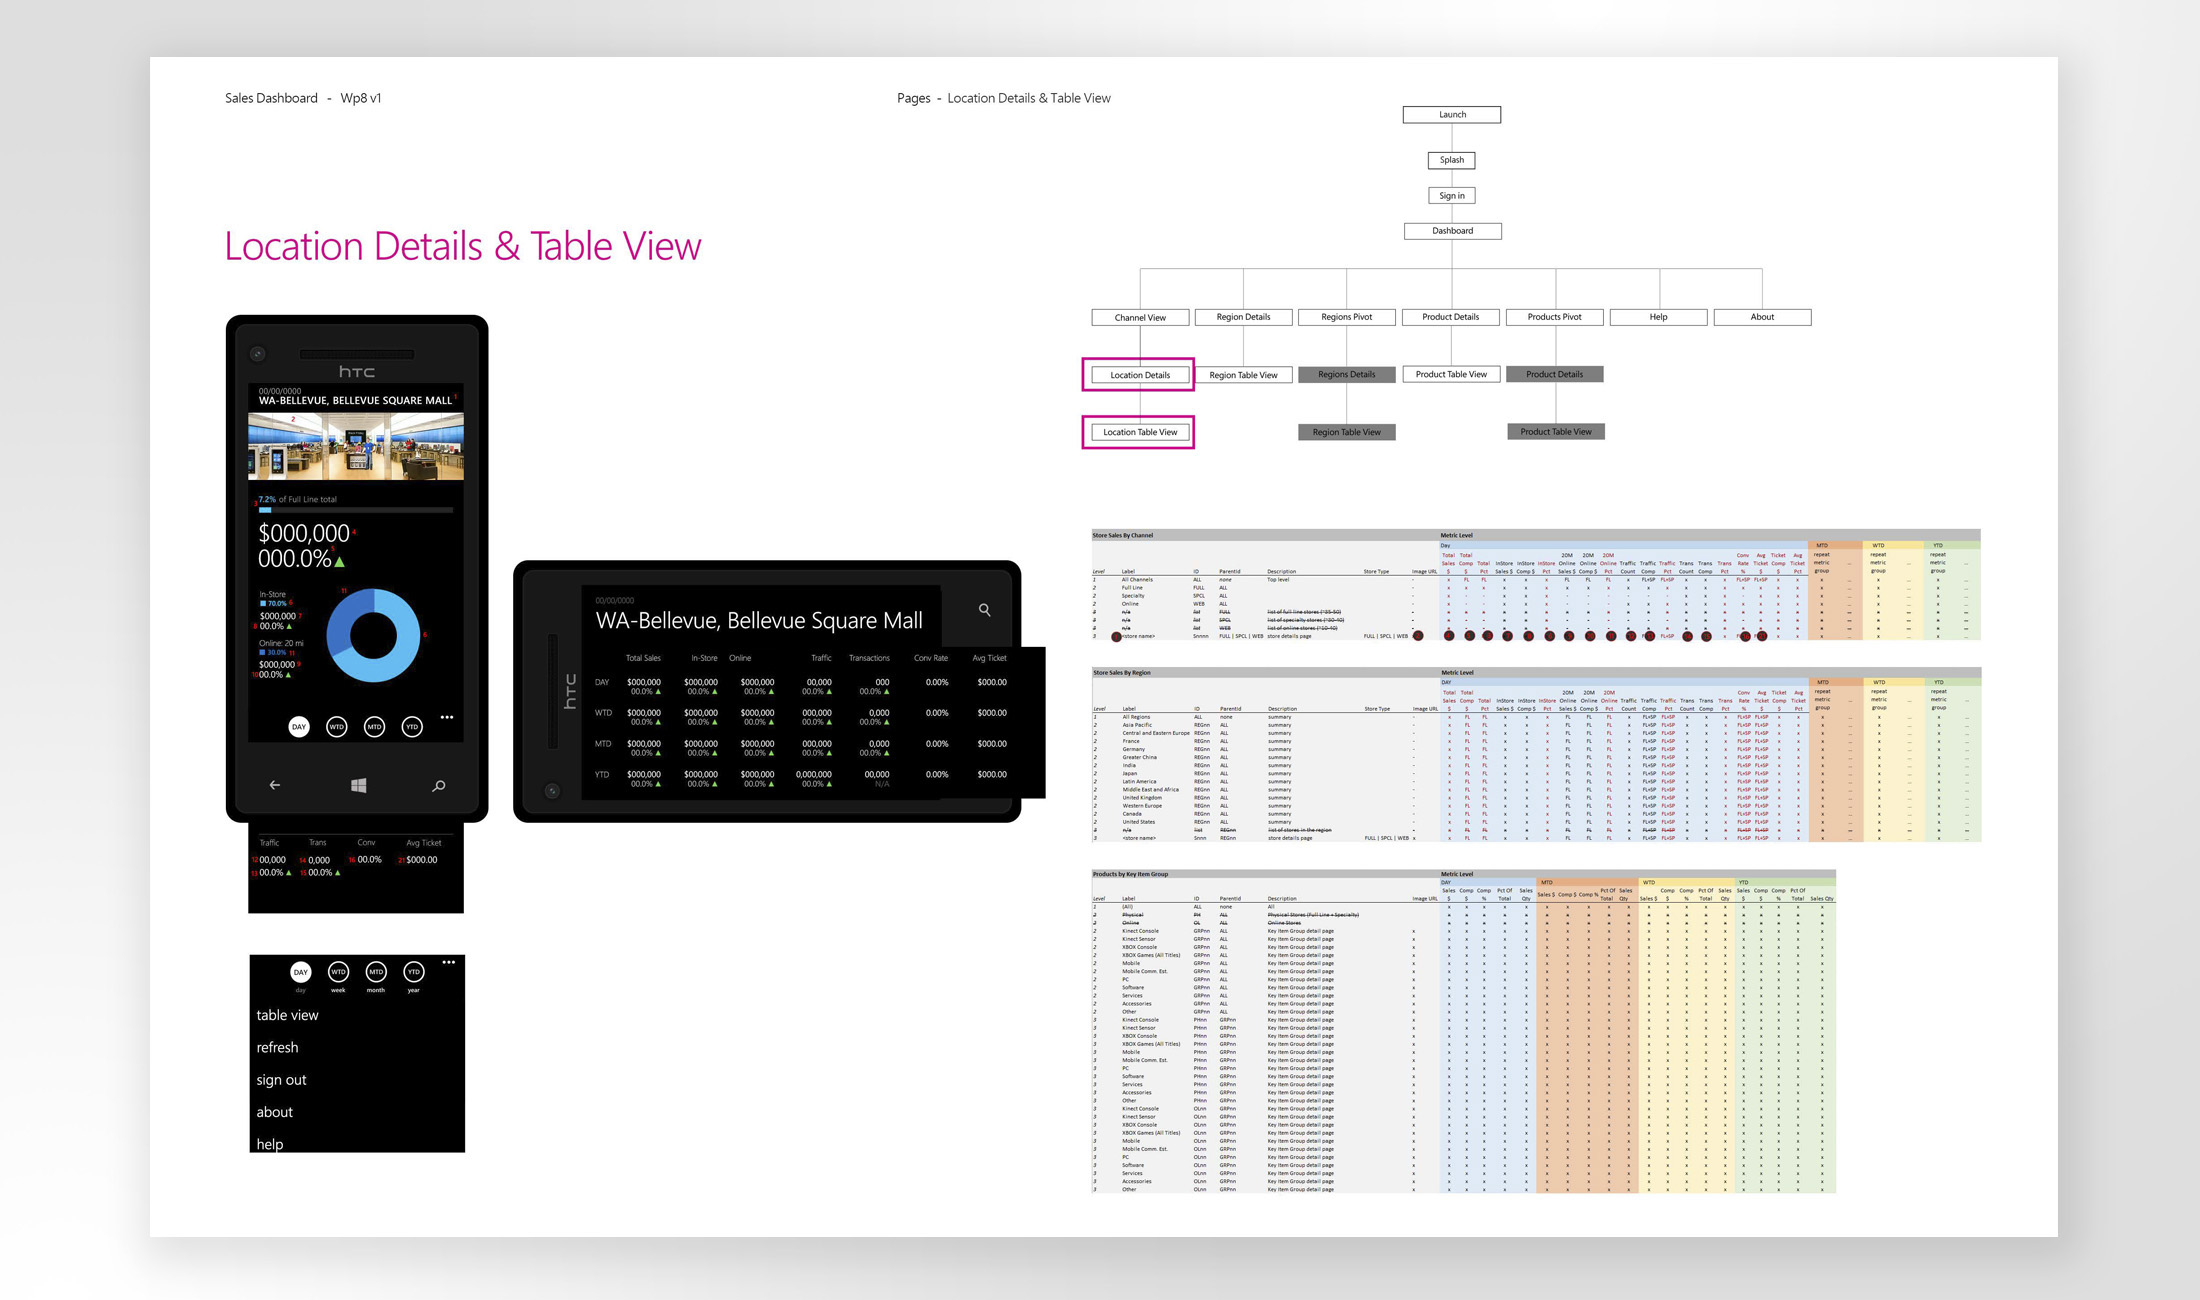
Sitemap
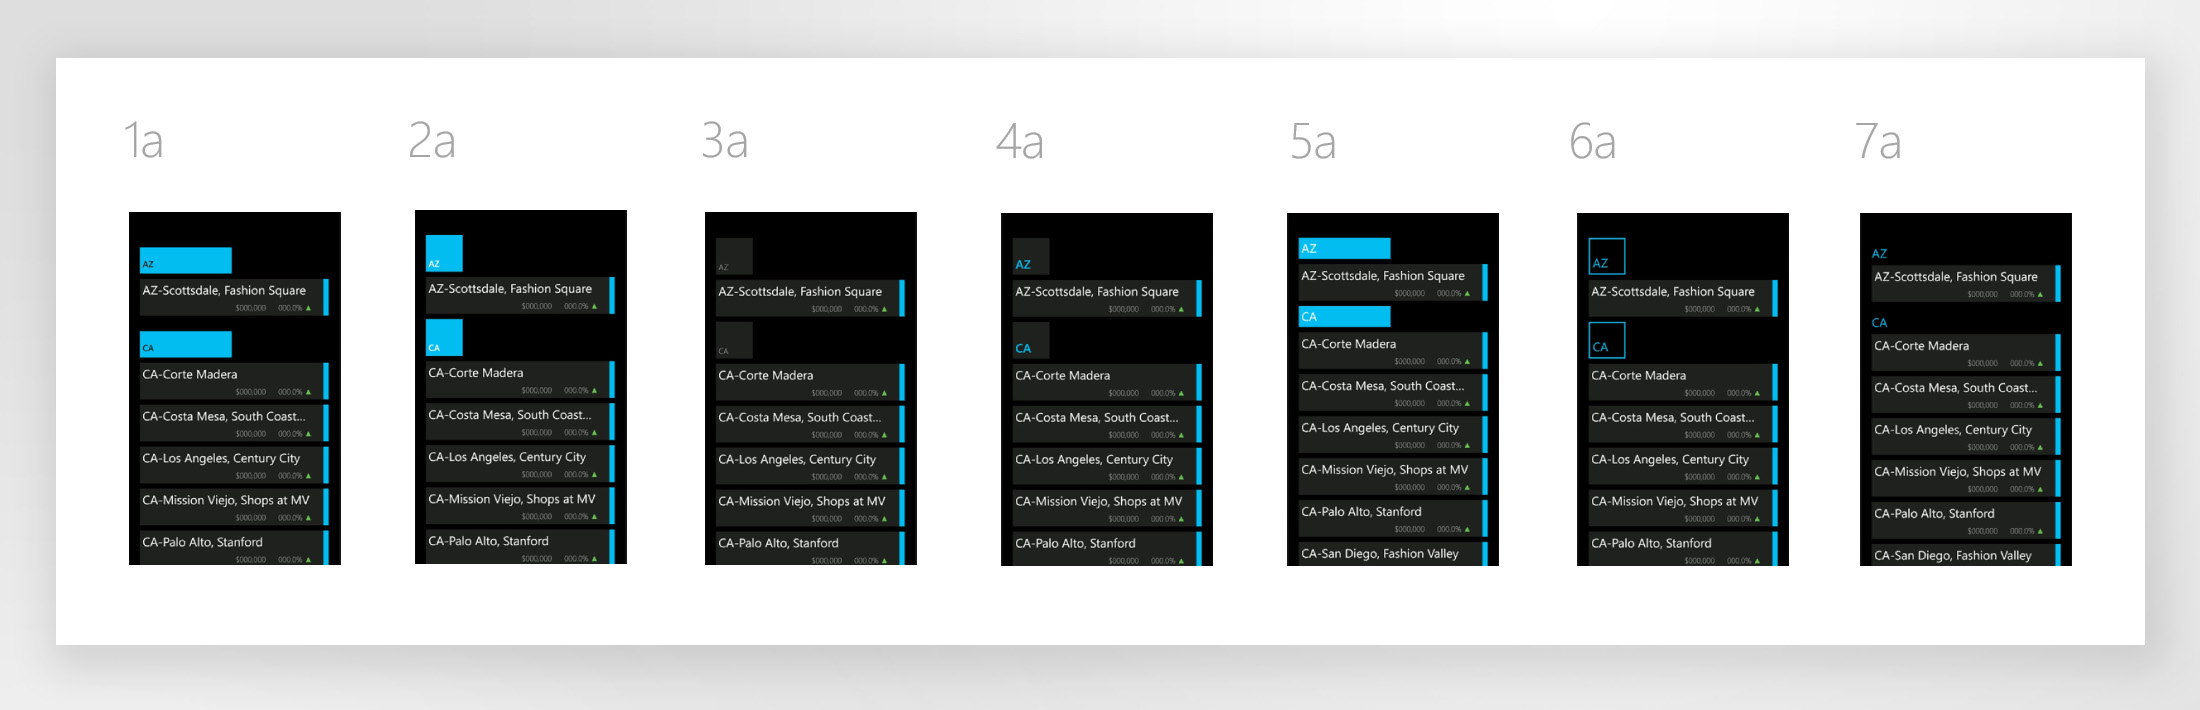
Wireframes
Some early mocks that show some variations of the dashboard and of a detail page of a specific store’s sales.
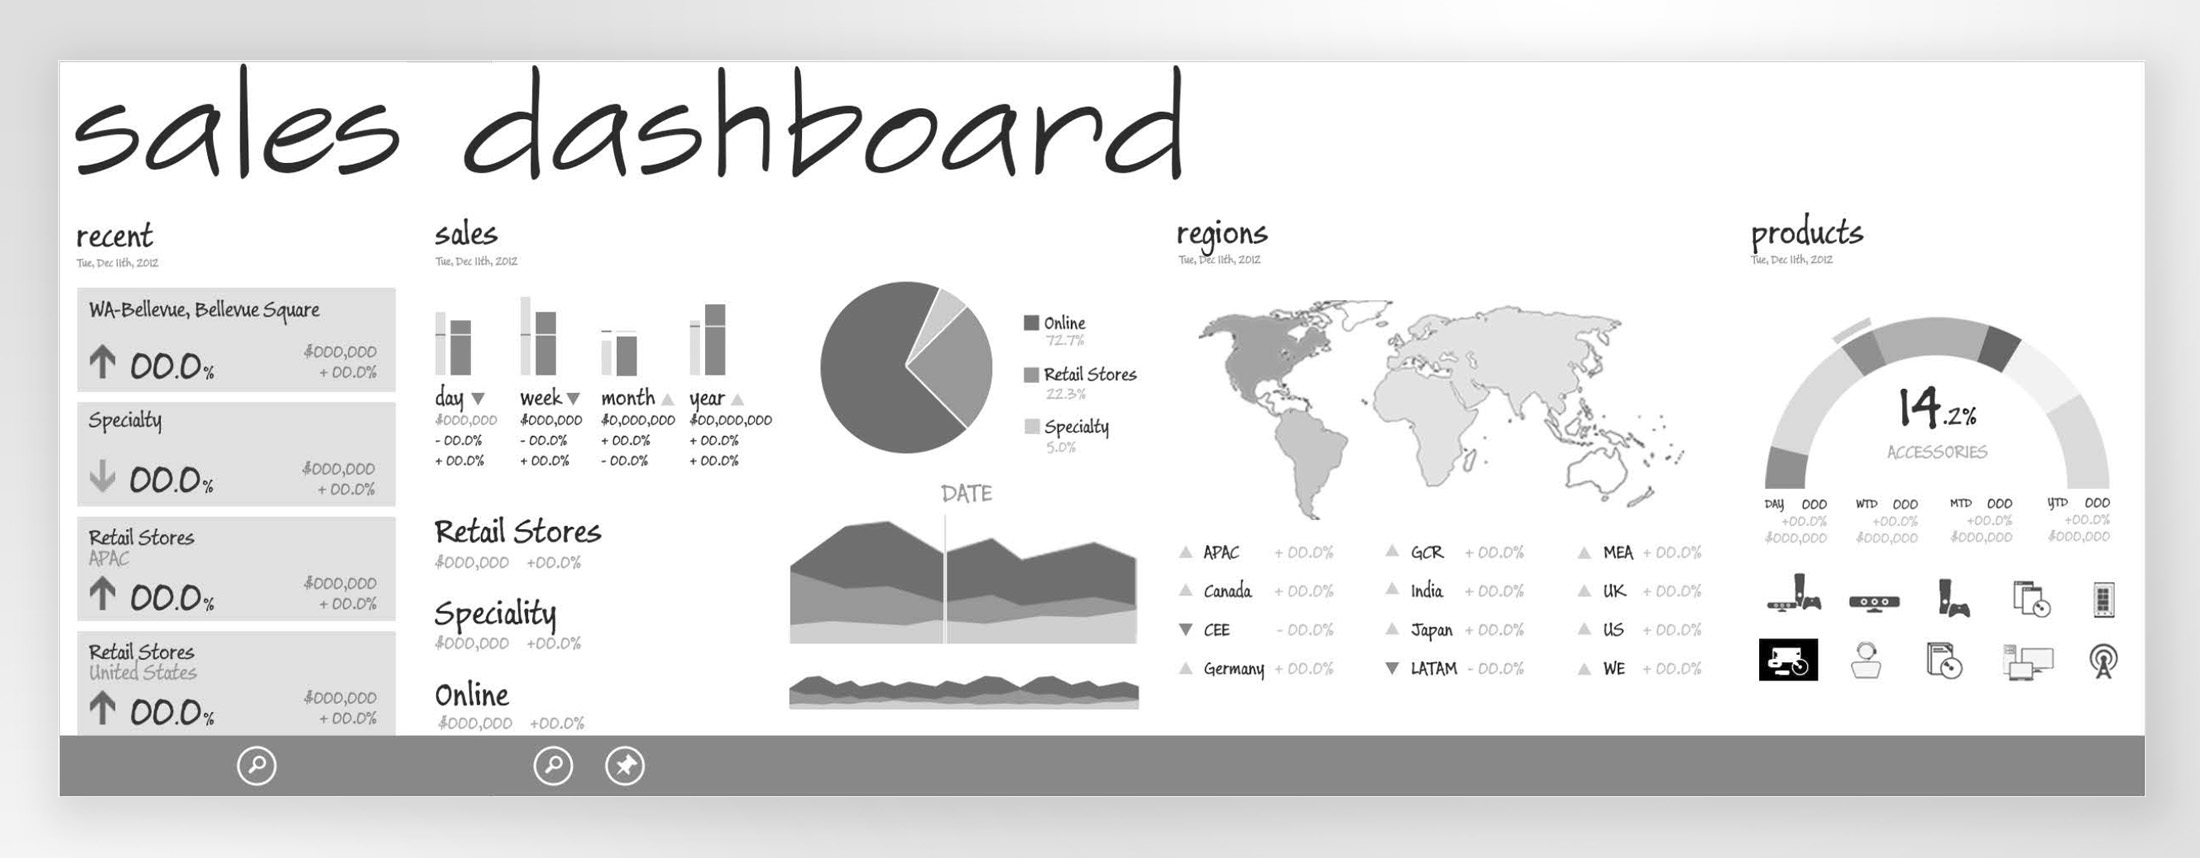
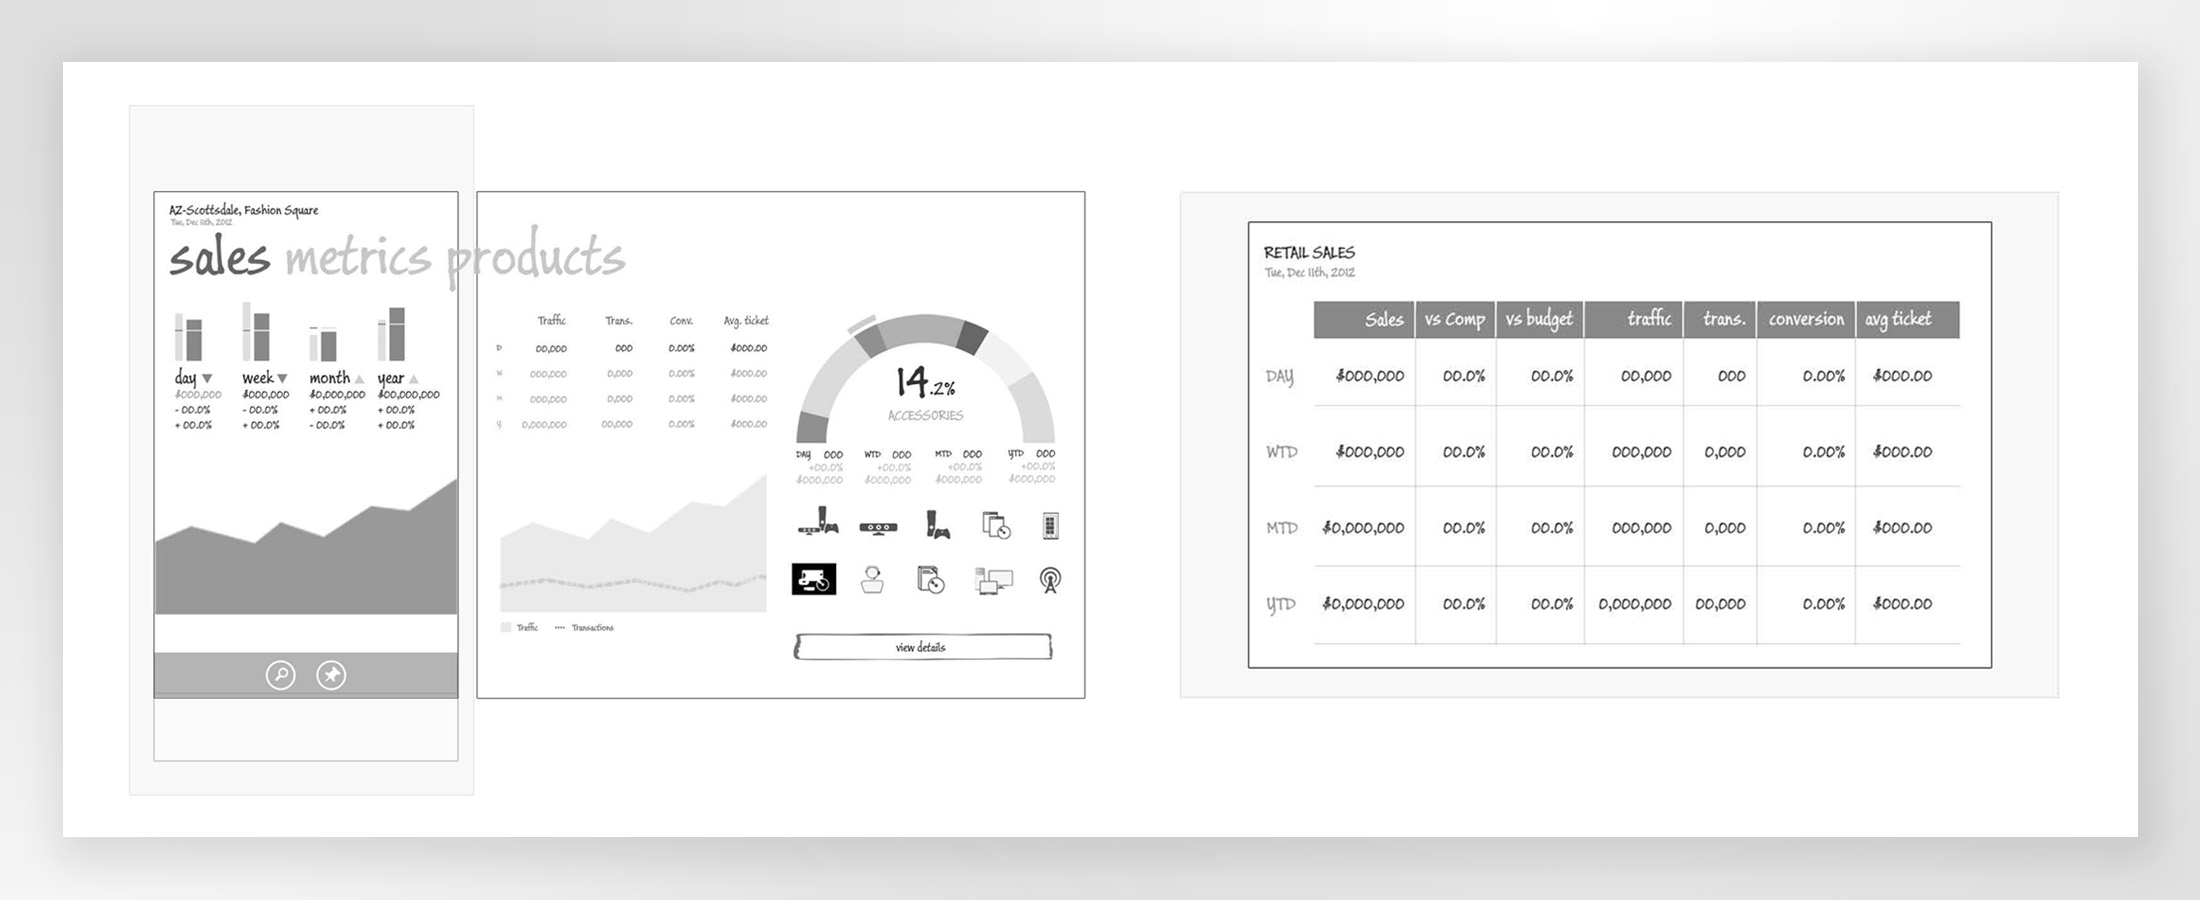
Design explorations
Throughout the design, we made sure to align to the standards and patterns used in Windows Phone applications. Once we started the visual treatment, we explored multiple variations of every component, from studies of the sales controls on the region map, to the quick-jump navigation on list views.
Final design
Each channel was assigned a color which was carried throughout the application. The menu bar offered the user ability to filter the data based on Today, Week-to-Date, Month-to-Date, or Year-to-Date. In some sections it allowed to see the information in a table view (which was also launched when user flipped the phone to landscape mode). In the main dashboard, we explored several treatments for the products area as well, including an illustration or a photo, but ultimately decided to keep it simple with a graph, as this app was designed to be of the content-first type.
Prototype
Documentation
Part of the deliverables included a mapping of the data points used in the mobile app to the datapoints included in the sources of the daily reports.
Learnings
The prototype was really well received by several stakeholders and members of the leadership team, however due to business priorities it was not implemented. It still was a great exercise for designing for mobile and I learned some more about data visualization.